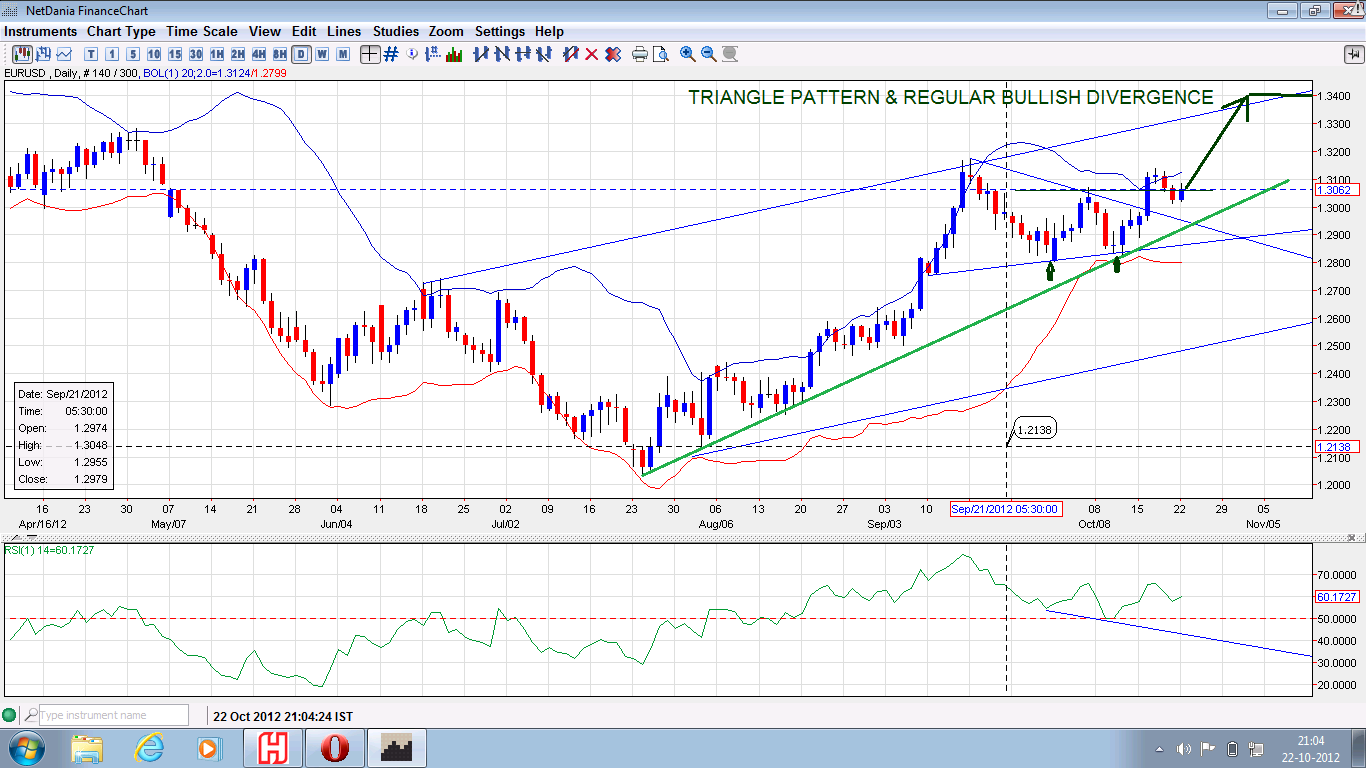
EURUSD has formed triangle pattern
Yesterday Pair was in round 50pips range bound
As per Elliott Wave theory, Pair lies in Wave (3) of Wave 5 (impulsive Wave)
If Pair breaks above 1.2582 then pair may test resistance 1.2740
alternative view if Pair breaks below 1.25 then it will be temperary downside towards 1.24
Support @1.244 and resistance @1.2580,1.2690, 1.2740
Elliot Wave charts refer counting in charts