NZDUSD is found near resistance zone
Support & resistance level are drawn in red and blue color in the charts
if Pair break above 0.8240 then pair may test resistance @0.8374
Alternate view pair has most rejecting level @ 0.8240 if pair breaks below trendline then it will be temporary downside towards support in blue
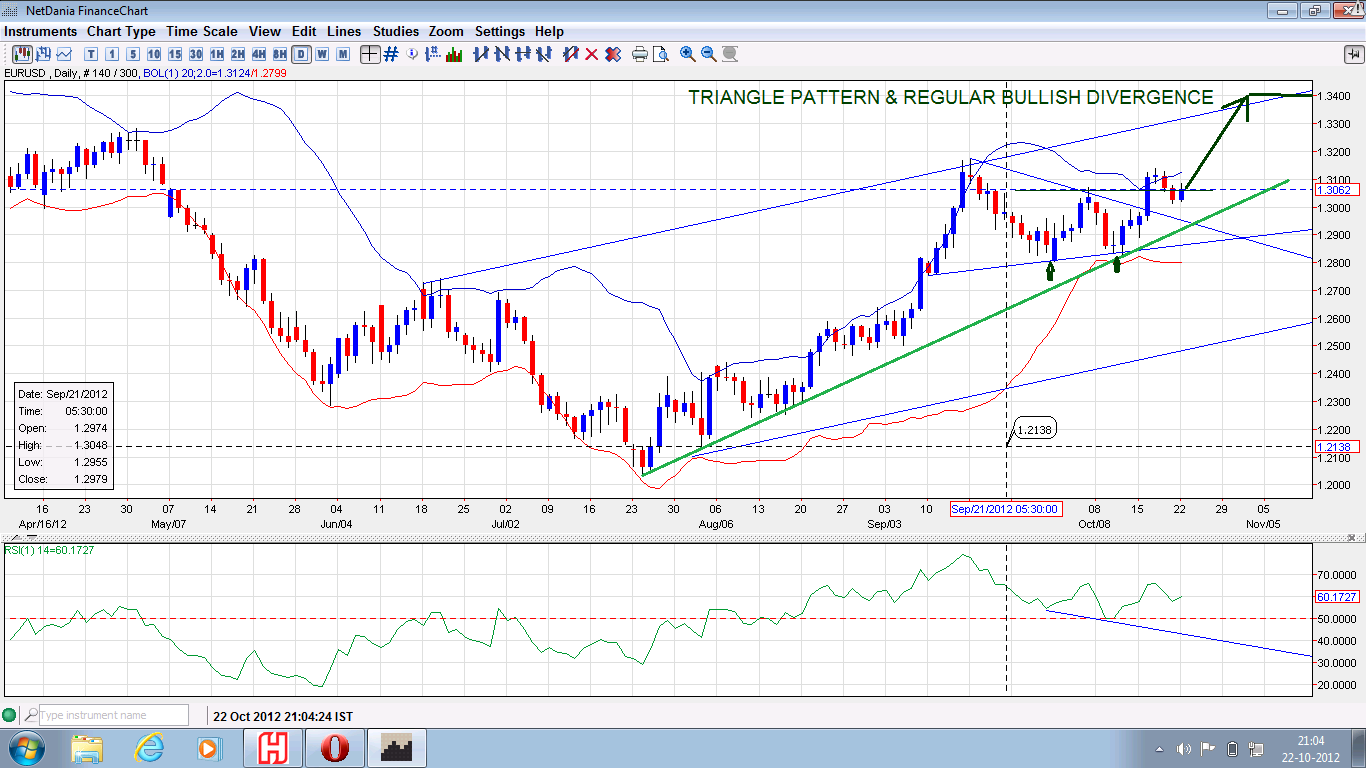
EURUSD has formed three patterns
1. Triangle pattern
2. double bottom pattern
3. regular bullish divergence
Above pattern has formed above trendline and RSI(14) IS ABOVE 50
i feel fed will not change it's policy before presidential election in US on November 6, 2012
LONG TERM VIEW IS BULLISH TOWARDS 1.3300 BEFORE MID NOVEMBER
please refer chart below