Showing posts with label trendline. Show all posts

Monday, January 21, 2013

EURUSD has formed Double Top Pattern

EURUSD has formed Double Top Pattern with neckline @1.3260

Pair has Support @1.3250 and Resistance @1.3340 Strong 1.3402 

Downwards
if Pair Breaks level @1.3250 then pair may test support near 1.310 & 1.30

Upwards

if Pair breaks Jan 14, 2013's high @1.3402 then it has Strong resistance @1.3485  which is 50% retracement of rally 2011-2012


Daily Chart 

Pair has formed regular bearish divergence with RSI 14(RELATIVE STRENGTH INDEX)


Thursday, December 13, 2012

GBPUSD - 20121213

GBPUSD has strong resistance @1.6182 pair is moving in upside channel
Pair has rejected from this resistance level almost three times 
Recent news: S&P cut UK outlook to negative
US DOLLAR is slowly becoming stronger

if pair manage to break support @1.6060 then it may test next level 1.6 & 1.5914 (23rd Oct.2012's low )

Resistance :  1.6182, 1.6256
support:        1.6000, 1.5914

Tuesday, October 30, 2012

NZDUSD 20121031

NZDUSD is found near resistance zone 

Support & resistance level are drawn in red and blue color in the charts 
if Pair break above 0.8240 then pair may test resistance @0.8374
Alternate view pair has most rejecting level @ 0.8240  if pair breaks below trendline then it will be temporary downside towards support in blue


Monday, October 22, 2012

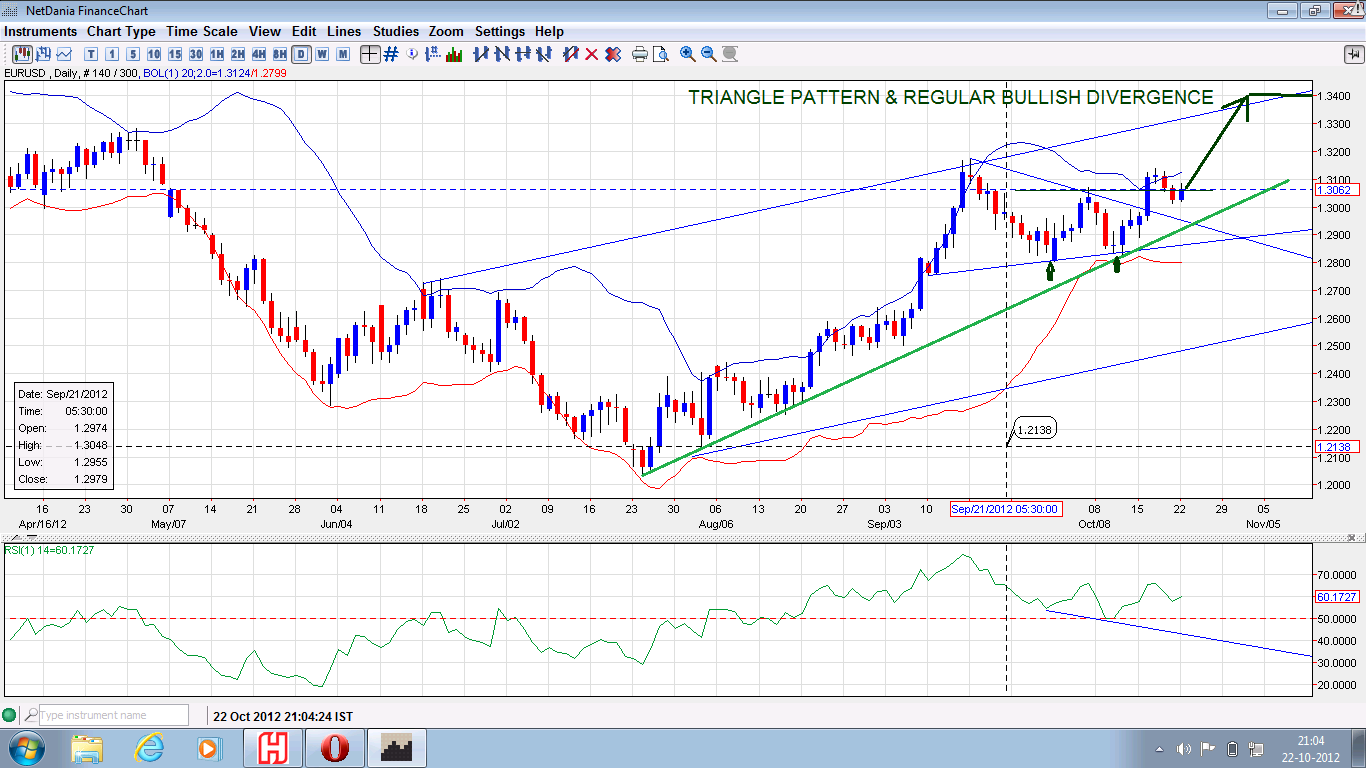
EURUSD has formed three patterns for bullish

EURUSD has formed three patterns

1. Triangle pattern

2. double bottom pattern

3. regular bullish divergence

Above pattern has formed above trendline and RSI(14) IS ABOVE 50

i feel fed will not change it's policy before presidential election in US on November 6, 2012

LONG TERM VIEW IS BULLISH TOWARDS 1.3300 BEFORE MID NOVEMBER


please refer chart below


Wednesday, October 10, 2012

AUDUSD HAS TRIANGLE PATTERN


AUDUSD has formed triangle pattern 
Pair has  support @1.0152 & resistance @1.0330
if Pair breaks above triangle then pair may test resistance @1.0330

ELLIOT WAVE COUNTING 


Tuesday, October 2, 2012

EURUSD BULLISH 2nd Sep

EURUSD has formed Bullish Emgulfing Pattern above trendline 
Pair has maintained Relative Strength Index (RSI) Above 50 level 
If Pair break above 1.2940 then pair may test resistance @1.3160
Recommend: Buy @1.2940 target @1.3140 , 1.33 Stop @1.2740
please refer chart below