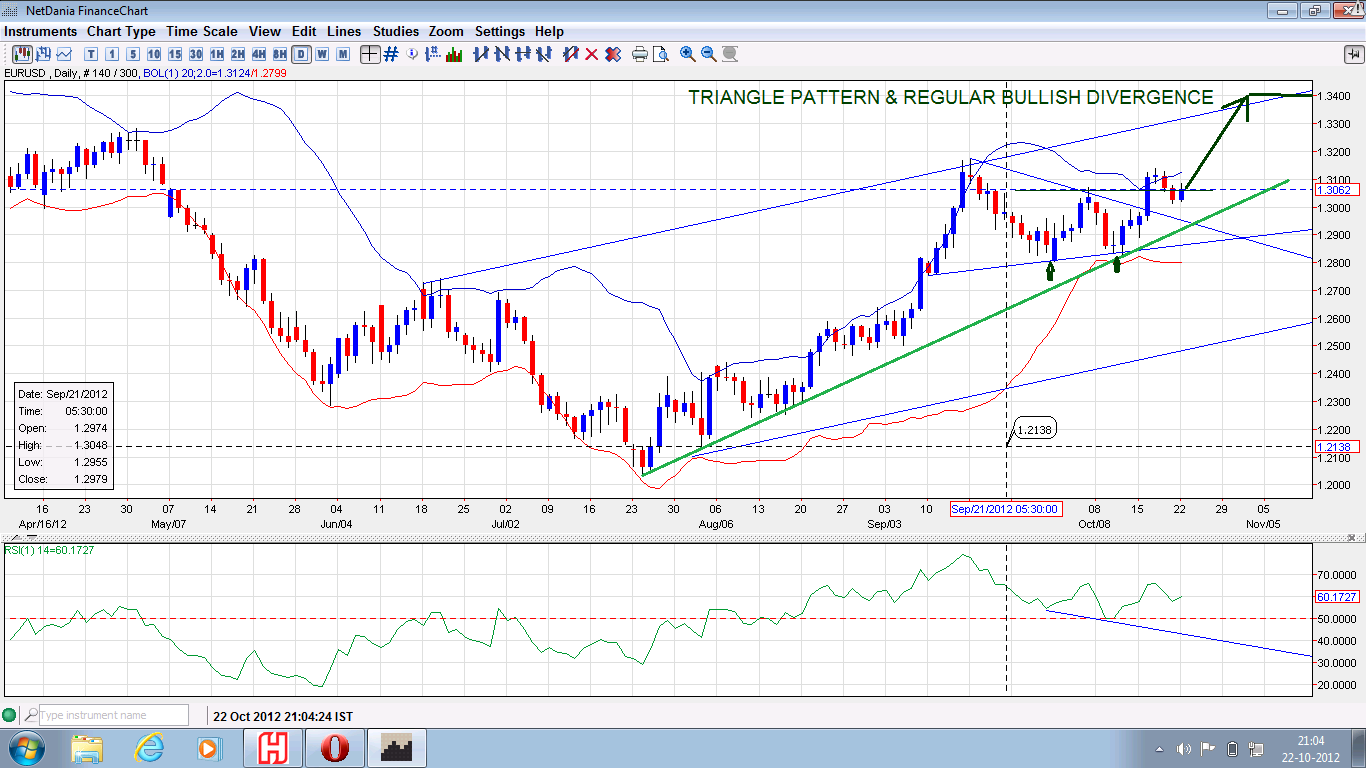
Support & resistance level are drawn in red and blue color in the charts if Pair break above 0.8240 then pair may test resistance @0.8374 Alternate view pair has most rejecting level @ 0.8240 if pair breaks below trendline then it will be temporary downside towards support in blue
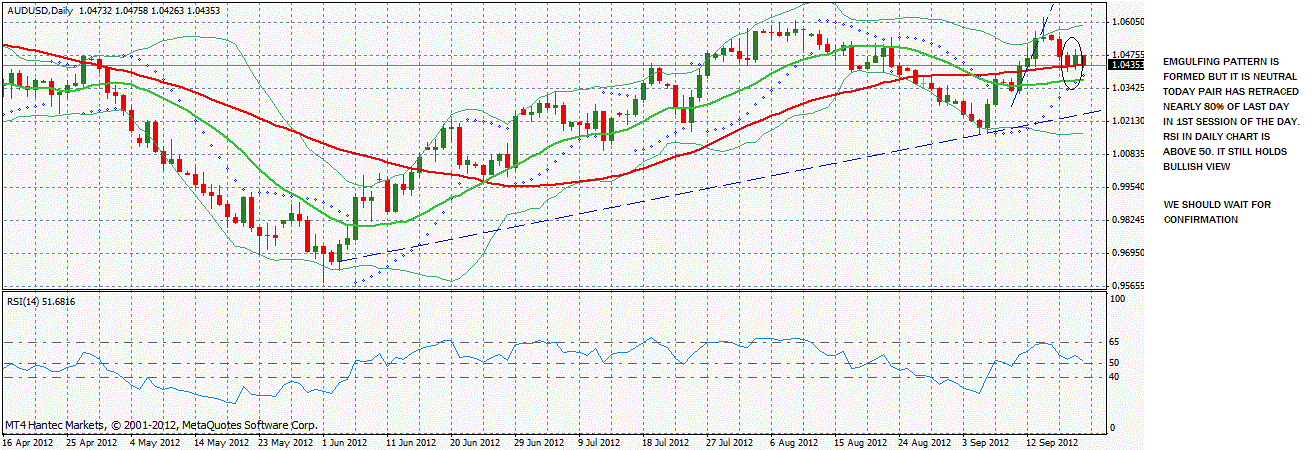
AUDUSD has formed Double Top pattern in Daily chart
Pair is rejecting from Support Zone ( 1.0152 to 1.0100)
Pair has formed bullish divergence in 4hourly charts
More chance Pair may reject from these level (pink Line)
i m looking more upside
if Pair breaks Support level @1.010 then Pair may test support@0.97
* ECB may struggle to meet market expectations
* Many see grim economy justifying further easing
* Data-driven Fed to watch job market, purchasers' survey
By Alan Wheatley
AMSTERDAM, Sept 2 (Reuters) - If Mario Draghi manages on Thursday to satisfy financial markets while forging a political consensus on how to lower southern Europe's sky-high bond yields, the European Central Bank chief should be offered the starring role in the next Mission Impossible movie.
Friday's U.S. job figures for August could be critical in determining how quickly the Federal Reserve acts on the promise of its chairman, Ben Bernanke, to ease monetary policy further if necessary to promote growth and a sustained recovery in the labour market.
But, given the potential of the euro zone's malaise to cause a global financial crisis and recession, Draghi's news conference following an ECB policy meeting will be the highlight of the week and could set the market tone for the rest of the year.
Draghi raised expectations so high with a pledge in late July to do whatever is necessary to preserve the euro that investors will be disappointed if they have to wait a bit longer for details of how the ECB's proposed bond-market intervention will work.
Nick Kounis, an economist at ABN AMRO in Amsterdam, said the big risk was that Draghi would fail to dispel the doubts of the Bundesbank, Germany's powerful central bank, over the legality and effectiveness of buying Spanish and Italian bonds.
The Bundesbank does not have a veto at the ECB, but its opposition could limit the scope and thus the credibility of a bond-buying programme.
"It's difficult to be confident, but we do think on balance that he will come with something substantial," Kounis said.
Another growing risk is that the ECB's prospective conditions might prove too tough to lure Spain to swallow its pride and seek assistance from the European Stability Mechanism. The ESM, the euro zone's embryonic rescue fund, is expected to work alongside the ECB by purchasing peripheral countries' bonds when they are first auctioned.
Conversely, Julian Callow with Barclays Capital said the conditions might not be applied strictly enough, taking pressure off governments to get their finances in order.
"There is a danger that financial markets, which have already moved in anticipation of ECB interventions, may be disappointed by euro area developments," Callow said.
SLUGGISH PAYROLLS
Bond strategists at Deutsche Bank estimate that markets are pricing in bond buying of about 200 billion euros and are attaching a two-thirds probability to a quarter-point cut in the ECB's main financing rate, now at 0.75 percent.
Unemployment in the 17-nation euro zone was a record 11.3 percent in July, and David Owen, an economist in London with Jefferies, said the gloomy economic picture would justify fresh monetary stimulus even if the spread between benchmark German bonds and other countries' debt was zero. In fact, investors buying 10-year Spanish bonds are demanding a risk premium of about 5.5 percent.
"Whatever is announced at the ECB's press conference next Thursday, one should not lose sight of the bigger picture of a euro area economy sliding back into deeper recession," Owen said.
The U.S. economy is doing a bit better, but growth is sub-par and stagnation in the job market is a "grave concern" in the words of Bernanke, who spoke at a Fed conference in Jackson Hole, Wyoming, on Friday.
Employers are expected to have added 125,000 non-farm jobs in August, down from 163,000 in July and far too weak to make a dent in the jobless rate, which is likely to have been unchanged at 8.3 percent, according to economists polled by Reuters.
The Institute of Supply Management's monthly manufacturing survey on Tuesday will not give the Fed much encouragement either. Forecasters expect it to have edged up from 49.8 in July to 50 in August, the demarcation line between expansion and contraction.
Lacklustre figures are bound to ratchet up speculation that Bernanke will press the Federal Open Market Committee, the U.S. central bank's policy-making panel, to provide fresh monetary stimulus when it meets on Sept. 12/13.
"The only questions are what form the easing will take and whether he can convince the rest of the FOMC to go along," said Kevin Logan, chief U.S. economist at HSBC.
This service is not intended to encourage spam. The details provided by your colleague have been used for the sole purpose of facilitating this email communication and have not been retained by Thomson Reuters. Your personal details have not been added to any database or mailing list.
If you would like to receive news articles delivered to your email address, please subscribe at www.reuters.com/newsmails
Quotes and other data are provided for your personal information only, and are not intended for trading purposes. Thomson Reuters and its data providers shall not be liable for any errors or delays in the quotes or other data, or for any actions taken in reliance thereon.